

By MD Jalal Uddin | Ecommerce Advertiser | TikTok & Meta Ads Specialist May 2026 · 8 min read
Most ecommerce sellers I talk to are watching the wrong number.
They check ROAS. They celebrate when it hits 3x or 4x. They scale the budget. Then a few weeks later they’re confused about why their bank account doesn’t reflect the “success” their ads manager is showing.
I did the same thing my first year running paid traffic. Scaled a campaign to $800 a month based on a 3.8x ROAS. Looked great. Was actually losing about $60 per week once I factored in product cost, shipping, and transaction fees.
That experience is why I now use a TikTok Ads ROI Calculator before I touch a single budget dial. And it’s why I built this one specifically for ecommerce campaigns — because most calculators online either ignore shipping costs or don’t break down CPA properly.
This guide explains exactly how to use it, what each metric means in plain language, and what your numbers should look like before you consider scaling.
TikTok Ads ROI Calculator
Why ROAS Alone Will Mislead You
Let me get this out of the way first, because it’s the most common mistake I see.
ROAS — return on ad spend — measures one thing: how much revenue came in for every dollar you spent on ads. A 4x ROAS means $4 of revenue for every $1 of ad spend. Sounds profitable, right?
Not necessarily.
If your product costs $18 to source, $5 to ship, and you’re selling it for $35 — your gross margin per order is only $12. Now if your CPA (cost per customer) is $14, you just lost $2 on every single order, even with a solid ROAS.
This is the gap a TikTok Ads ROI Calculator fills. It pulls every cost into one calculation — ad spend, product cost, shipping, total orders — and shows you the number that actually matters: did you make money or not?
What This TikTok Ads ROI Calculator Actually Measures
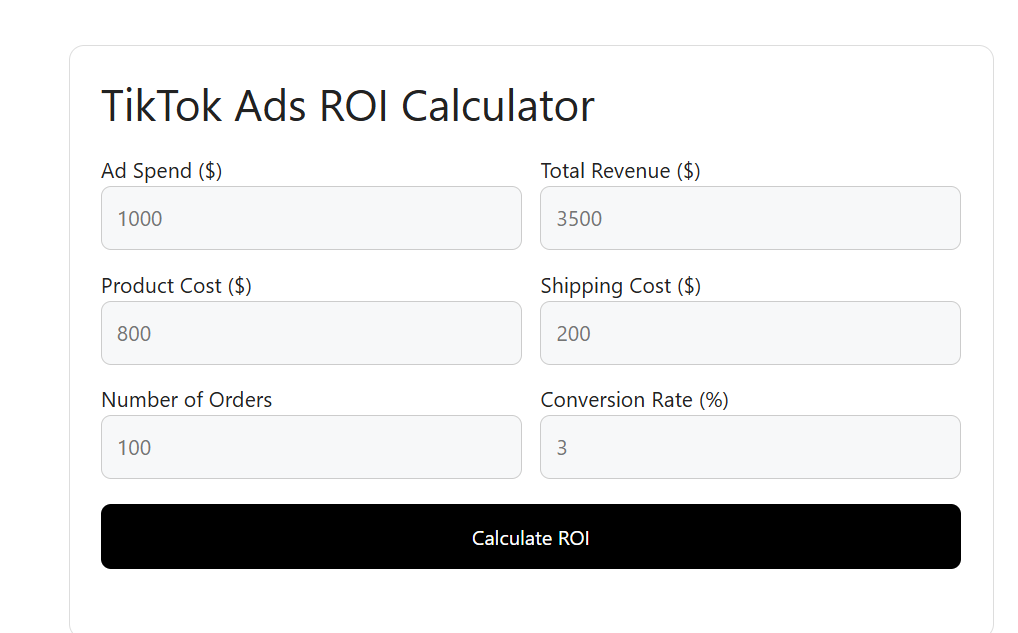
The calculator takes six inputs and turns them into five outputs. Here’s exactly what each one tells you.
The Six Inputs
| Input | What to Enter |
|---|---|
| Ad Spend | Exact amount spent in TikTok Ads Manager |
| Total Revenue | Total sales generated from the campaign |
| Product Cost | Your cost to source or manufacture each unit |
| Shipping Cost | Your fulfillment cost per order |
| Number of Orders | Total orders from the campaign period |
| Conversion Rate | Percentage of visitors who purchased |
One thing most calculators miss: product cost and shipping should be per unit, not totals. The calculator multiplies by your order count automatically, which gives you a much more accurate cost picture.
The Five Outputs
ROI (Return on Investment) The most important number. Positive ROI means your campaign made money after every expense. Negative means it didn’t, regardless of what ROAS says.
ROAS (Return on Ad Spend) Revenue divided by ad spend only. Useful for comparing creatives — not for deciding whether to scale.
CPA (Cost Per Acquisition) How much you paid in ad spend to get one customer. Compare this against your profit per order to know if the math works.
Net Profit The actual dollar amount you kept after all costs. This is your real result.
Average Order Value (AOV) Average spend per customer. If this is low, upsells and bundles are your fastest ROI lever.
A Real Calculation — Step by Step
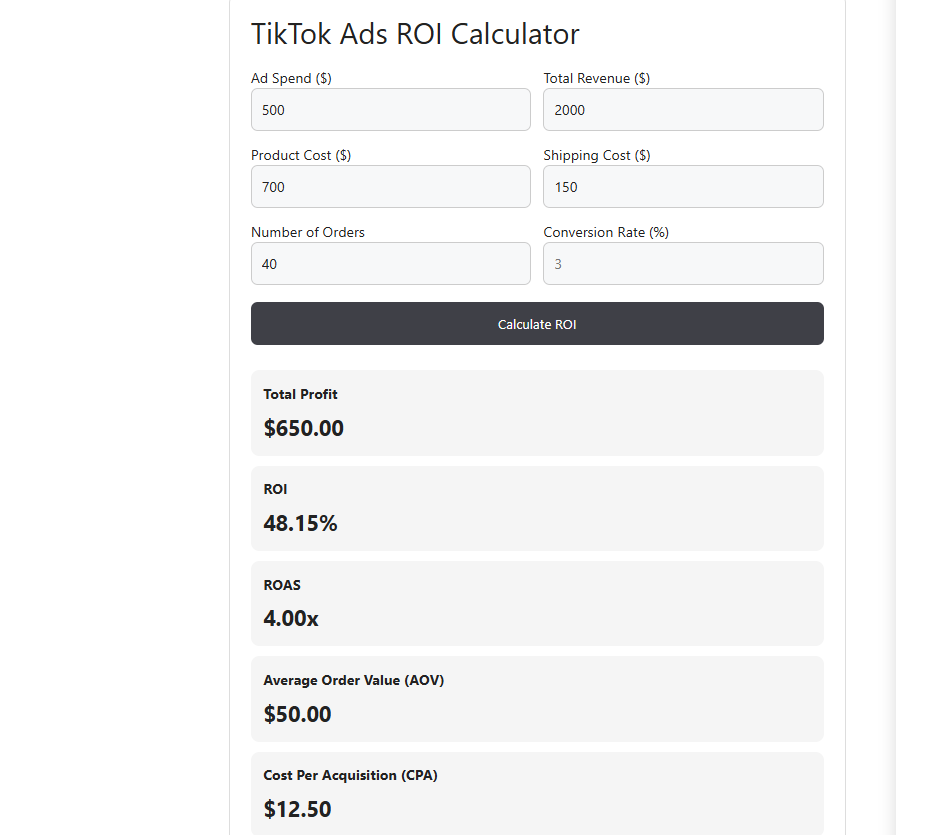
Let me walk through a real example so you can see how the numbers work together. These are from an actual campaign a friend of mine ran for a kitchen product last quarter.
Campaign inputs:
- Ad Spend: $500
- Total Revenue: $2,000
- Product Cost per unit: $17.50 (× 40 orders = $700 total)
- Shipping per order: $3.75 (× 40 orders = $150 total)
- Total Orders: 40
Step 1 — Add up every cost
| Cost Item | Amount |
|---|---|
| Ad Spend | $500 |
| Product Cost | $700 |
| Shipping | $150 |
| Total Cost | $1,350 |
Step 2 — Calculate net profit
Revenue ($2,000) − Total Cost ($1,350) = $650 profit
Step 3 — Calculate ROI
(650 ÷ 1,350) × 100 = 48.1% ROI
Step 4 — Calculate ROAS
2,000 ÷ 500 = 4x ROAS
Step 5 — Calculate CPA
500 ÷ 40 = $12.50 per customer
So a 4x ROAS translated to a 48.1% ROI. That’s a genuinely strong campaign worth scaling. But notice — if product costs were higher (say $22 instead of $17.50), ROI would drop to around 30%. Same ROAS. Very different business reality.
How to Use the Calculator — The Right Way
Simple to use, but there’s a right approach and a wrong one.
Step 1 — Pull numbers from TikTok Ads Manager directly Don’t estimate. Open your campaign, select the exact date range you’re measuring, and copy the spend and revenue figures exactly. Estimates will give you meaningless results.
Step 2 — Use your actual COGS, not your “feeling” COGS (cost of goods sold) trips people up. Include the product cost only — not your time, not overhead for now. Just what you paid to source or make the unit.
Step 3 — Use your real shipping cost, not what you charge customers If you offer free shipping, your shipping cost is what you actually pay the carrier. Don’t enter zero just because customers don’t see it.
Step 4 — Enter orders from the same date range as your ad spend If you’re measuring a two-week campaign, only count orders from those two weeks. Mixing timeframes distorts every metric.
Step 5 — Read the ROI number first, then work backwards If ROI is negative, look at CPA versus your margin per order. That’s usually where the problem lives. If CPA is high, the creative needs work. If margin is thin, the pricing or COGS needs attention.
What Your Numbers Should Look Like
People always ask me — what’s a “good” result? Here’s how I think about it.
ROI Benchmarks
| ROI Range | What It Means | What to Do |
|---|---|---|
| Above 40% | Strong campaign | Scale carefully, watch for fatigue |
| 20% – 40% | Healthy campaign | Optimize and scale slowly |
| 0% – 20% | Marginal — risky to scale | Fix CPA or increase AOV first |
| Negative | Losing money | Pause and fix before spending more |
ROAS Benchmarks
There’s no universal “good ROAS” — it depends entirely on your margins. Here’s how to find yours:
Break-even ROAS = Selling Price ÷ Gross Profit Per Unit
If your product sells for $35 and your gross profit (after product cost and shipping) is $14, your break-even ROAS is 35 ÷ 14 = 2.5x. Any ROAS below 2.5x means you’re losing money, no matter what it looks like on screen.
Calculate this before you run a single ad. It takes two minutes and sets a real target.
Why This Calculator Is Built Specifically for Ecommerce
Generic ROI calculators exist everywhere. Most of them are built for service businesses or agencies — they don’t account for per-unit costs, shipping variables, or order volume.
This one is different in a few specific ways.
It includes shipping as a separate line item. For ecommerce, shipping is a significant cost that fluctuates by product weight, carrier, and destination. Lumping it into “product cost” hides the real number. This calculator separates it so you can see exactly how much fulfillment is eating into your margins.
It calculates CPA from ad spend only. Some calculators divide total cost by orders, which inflates CPA with non-advertising expenses. Knowing your ad-only CPA helps you compare campaigns and creatives accurately.
It shows AOV alongside profit. Average order value is the fastest lever most ecommerce sellers have to improve ROI without touching ads. Seeing it next to net profit makes it obvious when a bundle or upsell strategy would change the entire picture.
The Four Things That Actually Move Your TikTok ROI
I’ve run enough campaigns to know where the leverage is. It’s not usually where beginners look.
1. The Hook — More Impactful Than Targeting
TikTok’s algorithm is remarkably good at finding buyers if the creative signals intent clearly. But if your hook doesn’t stop someone in the first 1–2 seconds, the algorithm has nothing to work with.
Before I change targeting, bids, or budget on an underperforming campaign, I change the hook. Every time. It moves the needle more than anything else on this platform.
Test at least three different opening lines or opening shots before drawing any conclusions about a campaign.
2. Landing Page Conversion Rate
This one is brutal to discover late. I had a campaign last year with an $8 CPA — which sounds incredible — but the landing page was converting at 1.2% because it was slow on mobile. Fixing load time pushed conversion to 3.1% and my effective CPA dropped to under $4 without changing the ads at all.
If your CPA is high, check your landing page before touching the campaign. Specifically:
- Mobile load speed (should be under 2.5 seconds)
- Social proof visibility above the fold
- Clear, single call to action
3. Average Order Value
This is the easiest ROI lever that most sellers ignore. If your AOV is $35 and you add a simple “buy 2, save 10%” option at checkout, even a 20% uptake on bundles increases average revenue per customer significantly — while your CPA stays exactly the same.
Run the calculator with a $10 higher AOV and see what it does to your ROI. Usually it’s the difference between marginal and comfortable.
4. Product Margin — Not the Ads
Sometimes the campaign is fine. The product margin is just too thin for paid traffic. If your gross profit per order is $8 and TikTok’s minimum viable CPA in your niche is $12, no amount of creative testing will make that profitable.
The calculator shows you this clearly. If net profit per order (before ads) is below your CPA no matter what you do, the product pricing or sourcing needs to change — not the campaign.
TikTok Ads vs Facebook Ads — ROI Differences Worth Knowing
I run both platforms actively. Here’s the honest comparison.
| TikTok Ads | Facebook Ads | |
|---|---|---|
| CPA for cold traffic | Often lower on impulse products | More predictable across categories |
| Creative dependency | Very high — creative IS targeting | High but audience matters more |
| Learning phase | Faster on strong creatives | Slower, needs more data |
| Best for | Impulse buys, visual products, younger demos | Broader categories, retargeting, older demos |
| ROI volatility | Higher — can spike or crash fast | More stable week to week |
Neither platform is universally better. The ROI difference usually comes down to whether your product is naturally suited to short-form video discovery. If it needs explaining, TikTok is harder. If it’s visually obvious and solves an immediate problem, TikTok often outperforms.
Common Mistakes That Kill TikTok Ad ROI
These come up constantly. Worth checking before you run your numbers.
Measuring revenue instead of profit. TikTok Ads Manager shows revenue. Your bank account shows profit. They’re not the same. Always run the full calculation.
Scaling on day one results. Day one performance on TikTok is notoriously unstable. The algorithm is still learning. Give any new campaign at least four to five days before making scaling decisions.
Ignoring creative fatigue. A campaign that runs at 35% ROI for two weeks can drop to negative ROI in week three as your best audience segments saturate. Check your weekly ROI, not just campaign totals.
Not tracking returns. If you’re in a category with frequent returns — apparel, electronics accessories, certain home goods — your actual revenue is lower than TikTok reports. Build a return rate estimate into your calculation if you have historical data.
Frequently Asked Questions
What is a good ROI for TikTok ads?
For ecommerce with physical products, 20–40% ROI is a solid, sustainable range. Above 40% is strong and worth scaling carefully. Below 15% is too thin to scale safely — any variation in performance can push you negative. Calculate your break-even point first, then use that as your minimum acceptable ROI.
How is ROI different from ROAS on TikTok ads?
ROAS only compares revenue to ad spend. ROI includes every cost — product, shipping, fees. You can have a 4x ROAS and still lose money if your costs are high. ROAS is useful for comparing ads against each other. ROI tells you whether the campaign is actually profitable as a business.
What is a good ROAS for TikTok ads?
It depends on your margins. Calculate your break-even ROAS first: selling price divided by gross profit per unit. That’s your floor. Anything above it means you’re profitable on ads alone. Most ecommerce brands aim for 1.5x to 2x above their break-even ROAS as a comfortable scaling threshold.
Why does shipping cost matter so much for ROI?
Because it’s a real cost that comes out of every order’s profit. On a high-volume campaign, shipping can easily represent 10–15% of total costs. Ignoring it makes your ROI look significantly better than it actually is — and leads to scaling decisions based on wrong numbers.
Can I use this calculator for dropshipping?
Yes — it works especially well for dropshipping because the product cost and shipping fields map directly to supplier cost and fulfillment cost, which are the two biggest variables dropshippers deal with. Enter your AliExpress or supplier cost in product cost, and your shipping fee in the shipping field.
How often should I recalculate ROI during a campaign?
Weekly at minimum for active campaigns. If you’re scaling quickly — increasing budget by more than 20% week over week — check it every two to three days. ROI can shift fast on TikTok as audience saturation sets in.
Is this calculator free to use?
Yes, completely free. No sign-up, no email required. Just enter your numbers and get results instantly.
Final Thoughts
The difference between TikTok advertisers who scale profitably and those who burn through budget without results usually isn’t the product, the targeting, or even the creative quality.
It’s whether they actually know their numbers.
ROAS is a useful signal but it’s incomplete. ROI — real ROI, including every dollar spent on product and fulfillment — is what tells you if the business is working. And you can’t improve what you’re not measuring accurately.
Use this calculator before your next campaign launch to find your break-even ROAS. Use it weekly while your campaign runs to catch problems early. And use it before you scale anything — because scaling a losing campaign just means losing more money, faster.
The tool is here. The math is simple. The results will tell you exactly what to do next.
About the Author
MD Jalal Uddin has managed paid advertising campaigns for ecommerce brands since 2019, working across TikTok Ads, Meta Ads, and Google Shopping. He’s run campaigns from $50 test budgets to $15,000 monthly spends and writes about performance marketing from the perspective of someone who’s made most of the expensive mistakes already.